
SkateCoach
Nordic Skate Skiing
Technique Analysis App


SkateCoach helps cross country skiers optimize their skate skiing technique. Skate motion metrics are recorded while skiing and can be analyzed to help perfect a skier's technique.
New: The latest version of SkateCoach, Version 3.0, now has an artificial intelligence feature. SkateCoach can now learn your skating motions and tell you if your skate motions are too long or too short. See video for more information.
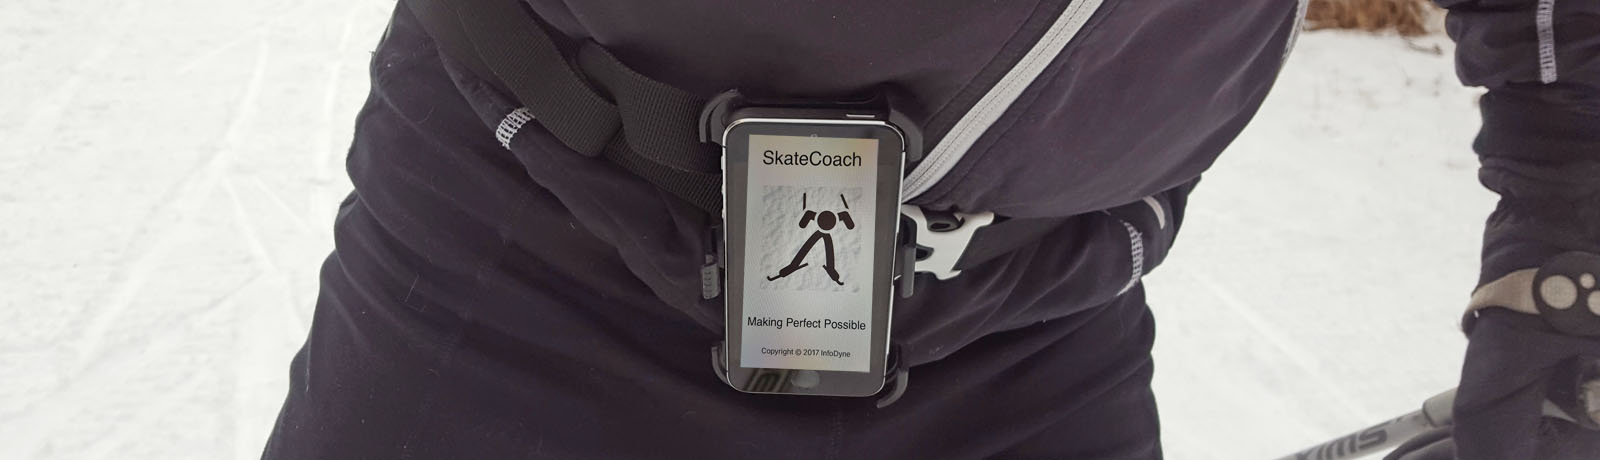
The SkateCoach app is run on an iPhone that is carried by the skier (clipped to a waist belt or inserted inside a jacket and wedged under a waist belt).
The SkateCoach app records skate motion metrics and scores the quality of the skier's skate technique. After the SkateCoach app is used to record data from a sample session, detailed information about one's skate technique can be reviewed. Types of information that is presented for technique analysis are: weight shift, glide, ski angle, acceleration and velocity metrics.
Until now, coaching of cross country skiing technique has been mostly a subjective activity. "You need to glide more". "You need your arms closer to your body".
There is nothing quantitative about the old school approach to ski technique coaching. A skier does not get feedback as to what percentage difference a technique change makes.
SkateCoach changes all of this. Now a coach and skier can know exactly how technique changes improve glide and speed. SkateCoach can show metrics that are not identifiable visually by humans. Like, what percentage of time is weight shift more on one side than the other. Or what side has slightly longer or shorter glide time, and what the fractional difference is. Or what side has stronger acceleration, and by how much.
The following sections on this web page explain how to use the SkateCoach app. Also included is the complete text of the SkateCoach app Help screen.
SkateCoach, the game changer ski coach that lives
in your phone!
 |
 |
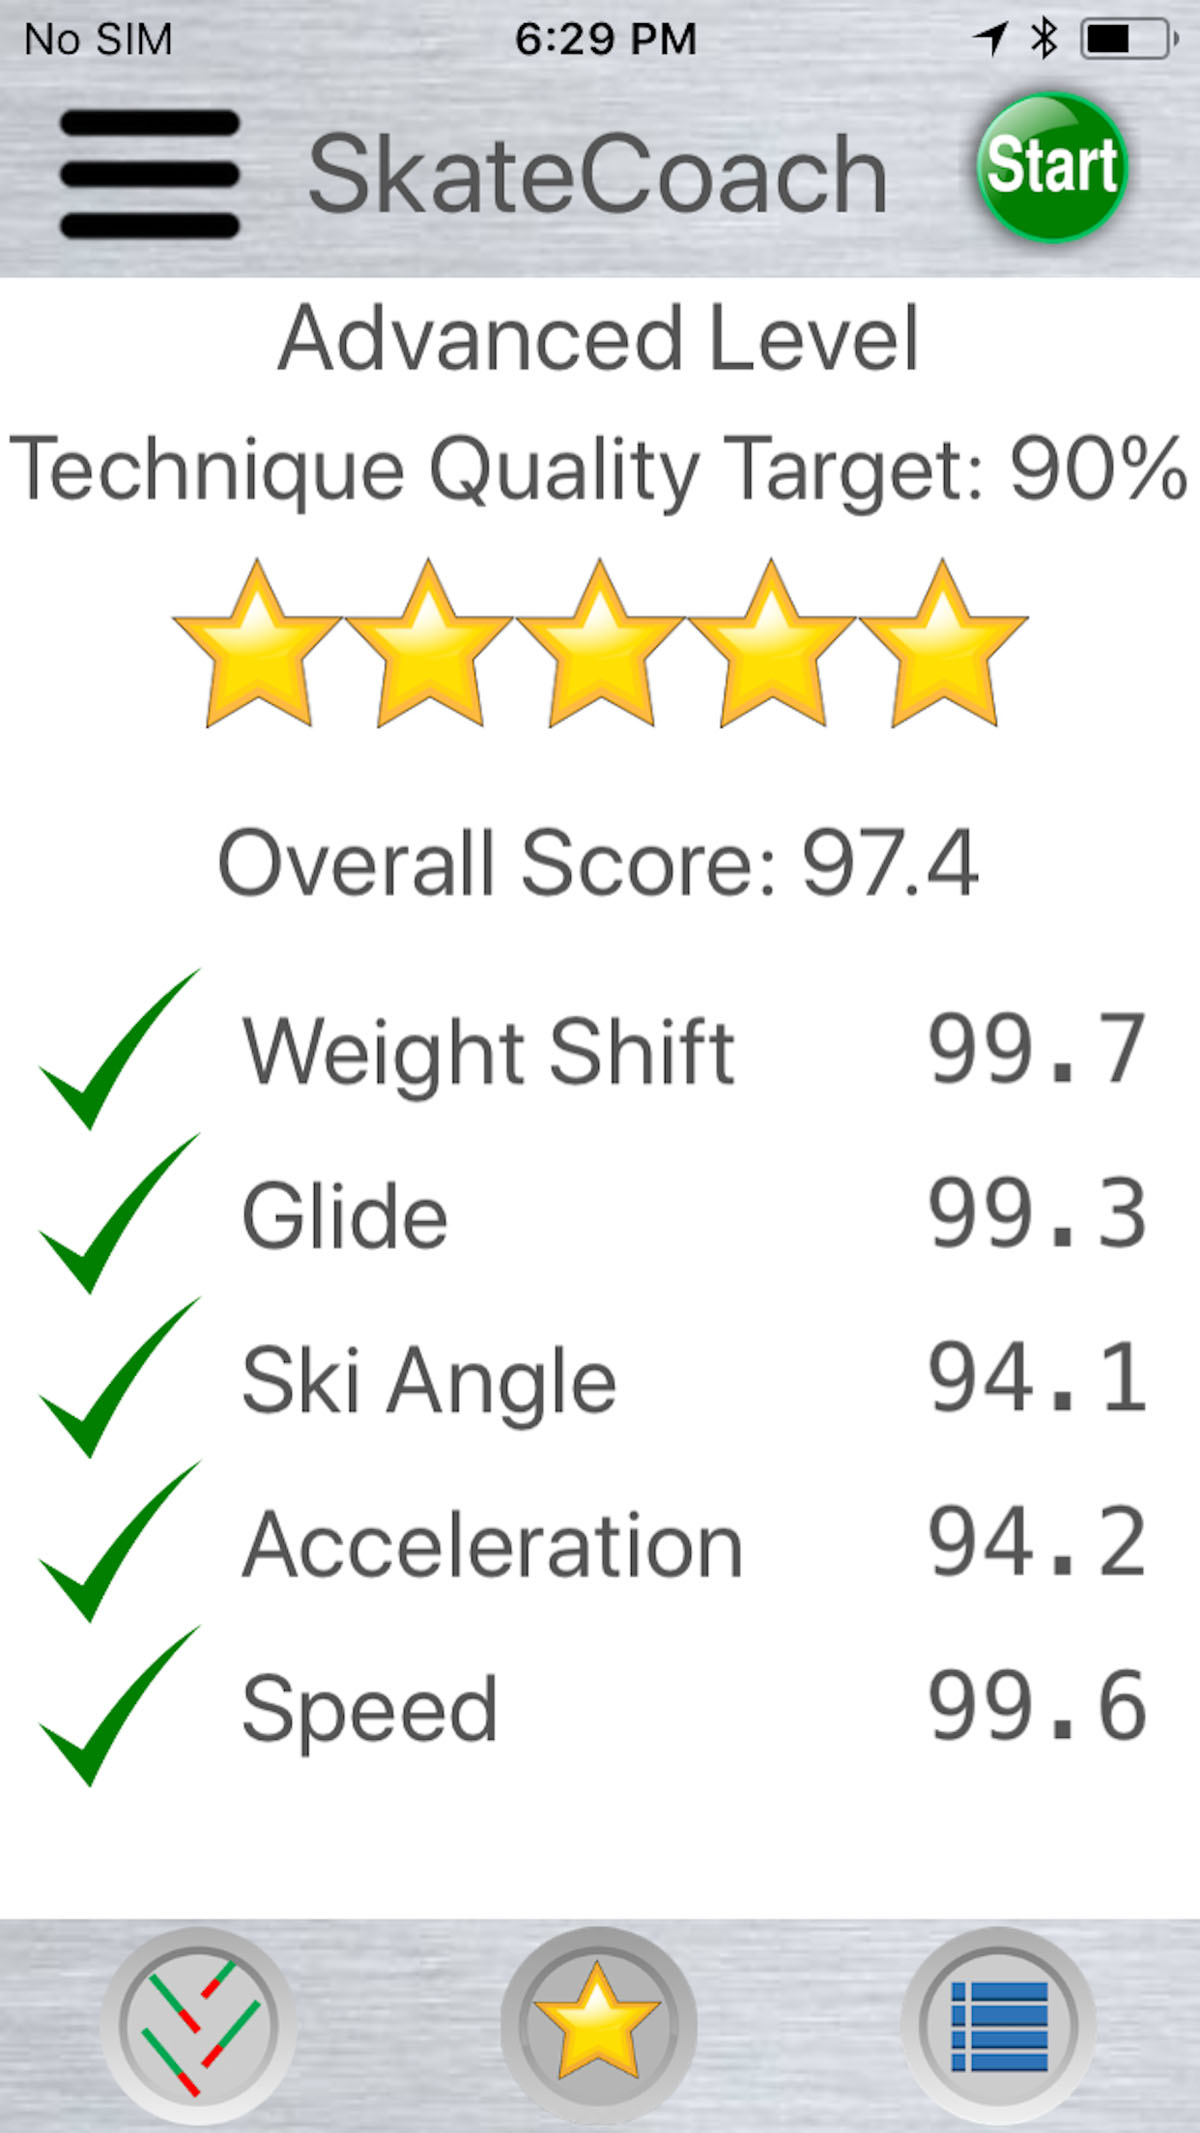 |
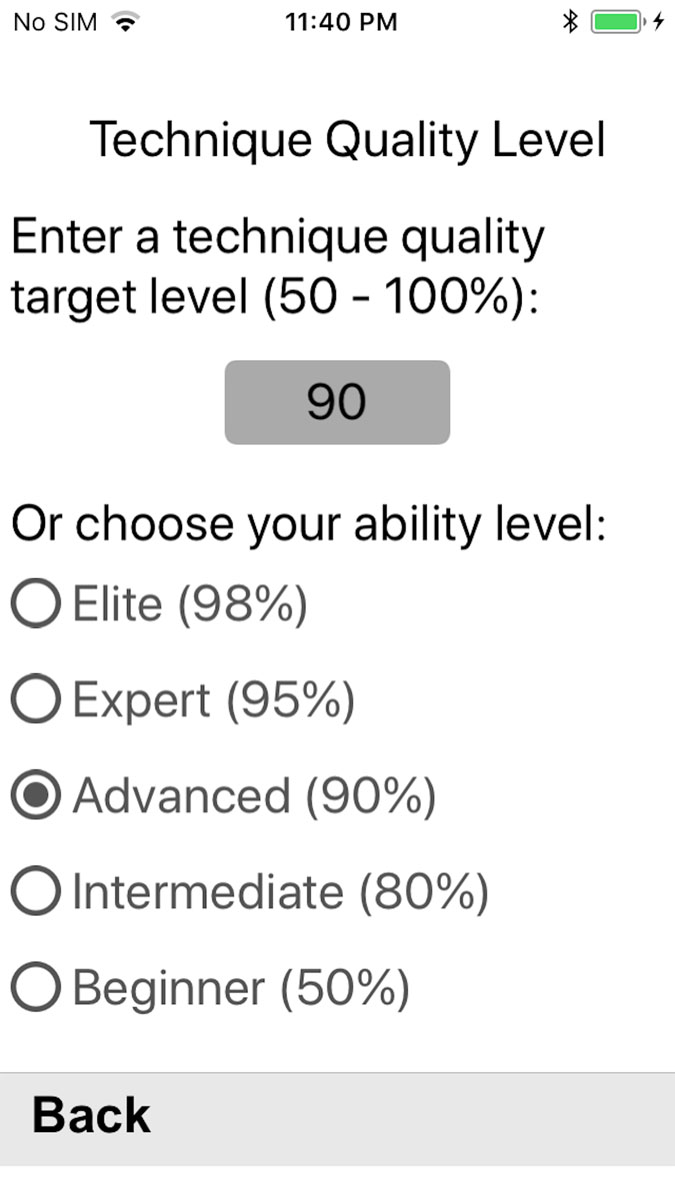
| Step 1: Choose a technique quality level. This is used to score stars and checkmarks on the score view screen. You only need to do this once. | Step 2: Set a countdown and sample time. Press the start button. Place the iPhone in a waist belt clip or wedge it into our waistband. Start skiing. | Step 3: SkateCoach will double beep when the sampling interval is over. Stop skiing and view the score view. An overall score is given. Checkmarks show which categories met your target quality level. |
|
|
|
|
You can scroll through the record of your skate skiing motions. |
You can also scroll through a detailed analysis of your skate skiing motions. |


 |
 |
 |
|
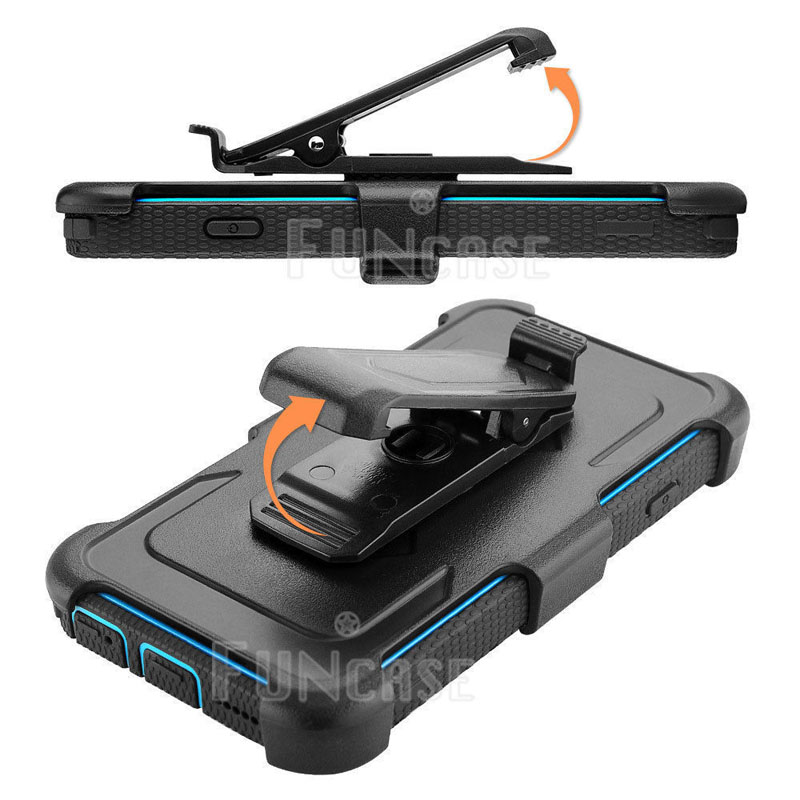
| Place phone inside jacket, firmly wedged under drink belt (preferred method). Or use a belt clip for your phone. Either way, make sure the phone is centered on your torso and securely attached so it does not wobble. If the phone wobbles the results will be inaccurate. | |||
| Update: An option that works well for holding your phone when running the SkateCoach app is a neoprene TuneBelt (see below). | |||
 |
 |
||
Help on using the SkateCoach iPhone app.
Basic Tips:
Make sure your iPhone is attached to you securely when you are running
SkateCoach. If the iPhone wobbles while running SkateCoach, results
will not be accurate. Make sure the phone is centered on your
torso.
Start with short countdown and sample intervals to get familiar with
using SkateCoach. For starters, use a 10 second countdown and a 30
second sampling period.
Make sure the GPS is turned on for your phone, and that GPS is enabled for the SkateCoach app.
Ski in a straight line. SkateCoach will not be accurate if you ski
around corners.
Use earphones if you have a problem hearing the SkateCoach countdown and
sampling beeps while you are skiing.
NEW!: SkateCoach now has artificial intelligence (AI) that learns how you skate. It then talks to you in real time to inform you if the time spent on your last skate and glide was too long or too short. Choose the AI Voice Setup option in the menu to activate this feature. The technique tolerance level you choose, see below, sets the parameters for AI feedback.
Usage:
1) Choose 'Technique Level Setup’ from the Menu. Select an ability
level. By doing this you chose a technique quality level that be used
to determine the number of stars you are scored and which technique
tests you passed on the Score View.
2) Press the Green start button. Make sure the countdown and sample
timers are what you want. The countdown timer should be set to the
amount of time it will take you to put the iPhone in your jacket, or
clip it to a belt, and start skiing. The sample timer should be set to
the desired length of your technique test. 2 minutes is the max time.
30 seconds is likely the most common setting.
3) Once the countdown starts, clip the iPhone to your drink belt strap,
or stick it into your jacket with the bottom section of the phone wedge
under a drink belt strap. Start skiing and get to the speed of your
test. Listen for the countdown timer to double
beep.
4) Ski a straight section of trail for the sample period. Skating
around corners will not give accurate results.
Use the V2 skate technique. If you use the V1 technique, which is not
symmetrical per side, you will have to switch leading sides halfway
through the test. Or do one test of V1 technique leading on your left
side, another on the right and compare them.
5) A consecutive double beeps will occur when the sampling is over. The
Score View will automatically be displayed. The Score View is explained
below. If you want to save the results of your test, save a screenshot
of the Score View. To do this, press and hold the top button and then
press the Home button.
6) Use the Detail View to learn more about your Score View results. Go
back to Step 2, make adjustments to your skate technique ... and see if
your SkateCoach score improves.
Graph View:
The Graph View shows your skating motions, as measured from the core of
your body. Green indicates acceleration during your skating motion.
Red indicates deceleration detected in you skating motion. Every time a
change in left or right direction is detected, the skate motion plotting
is reset to the middle X axis position (so your motions look more like
skate ski tracks). The grid on the Graph View shows the seconds of the
test. You can swipe your finger to scroll the Graph View. You can use
pinch gestures to make it smaller or larger.
Score View:
The Score View gives you high-level feedback on your SkateCoach sampling
session. The starts indicate how well you did for the technique quality
level that you chose. If you chose an Advanced
(90%) technique quality level, and your overall score was 92%, then you
would get 5 stars. If you scored 89, then you would get 4.5 stars. The
overall score is the average of the 5 technique category scores.
Below the overall score are
5 technique categories that are scored by SkateCoach. The categories
and how they are scored are listed below. If the score per category is
above the chosen technique quality level, a green check mark appears
next to the category label.
Definition: Tolerance - if you chose an Advanced technique quality level
of 90%, then the technique tolerance is 10%. Your measured technique
metrics need to be within this tolerance to meet the scoring criteria.
Weight Shift - The percentage of time weight is shifted equally (within
the tolerance limit) on each side.
Glide - The percentage of equal (within the tolerance limit) distances
measured when weight is shifted per side.
Ski Angle - The percentage of equal (within the tolerance limit)
average weight shift angles when weight is shifted per side. Weight
shift angle drives the ski angle.
Acceleration - The percentage of equal (within the tolerance limit)
average acceleration per skate motion per side.
Velocity - The percentage of equal (within the tolerance limit)
velocities per skate motion per side.
Data View:
Explanations of report data:
Total Skate Motions
How many times you skated during the sample time. Left side, right side
and total. Best results are when there are the same number of skate
motions on each side. If you use a longer sample times, the longer the
sample the less difference an odd number of motions will make.
Data colored red indicates this data is also on the Score view.
— Weight Shift —
Time Per Side (secs)
Time Per Side (%)
The amount of time you spent skating on each side.
Weight Shift Time Symmetry (%)
The percentage of time your weight shift was equal on both sides.
Skate Motions Per Minute
Your skate motions per minute rate, extrapolated if the sample period
was less than a minute.
Avg Skate Motion Time (secs)
Min Skate Motion Time (secs)
Max Skate Motion Time (secs)
The average, min and max times you spend on each skating motion.
— Distance —
Forward Distance (GPS) (m)
The distance as measured by GPS from the location your sampling starts
to the location where it ends. If you have a poor GPS signal, this
distance could be misleading.
Avg Forward Distance per Motion (m)
This is the above GPS-measured distance divided by the number of skate
motions for the sampling period.
Angular Distance (m)
This is the total distance your skis traveled while you were skating.
Because it is a the summation of angular distances it should be a
greater distance than the straight-line forward distance above.
Angular Distance per Side (%)
The distance your skis glided on each side.
Glide Distance Symmetry (%)
The percentage of angular skate motions that were the same.
Angular to Forward Dist Ratio
The amount of distance your skis traveled divided by the straight-line
distance between the GPS points at the start and end of your sampling
period. This value should be greater than one. If, for example, it was
1.08 … then your angular distance would be 8% longer than your
straight-line travel distance.
Avg Angular Dist per Motion (m)
Min Angular Dist per Motion (m)
Max Angular Dist per Motion (m)
Average, min and max distance of skate motions (ski glide).
— Angle —
Avg Angle of Motions (°)
The average angle of your weight shift motion. Can be related to the
angle of your ski when you skate.
Motion Angle Symmetry (°)
The percentage where ski angle, or motion angle, is symmetrical.
— Acceleration —
Avg Acc per Motion (G)
Average acceleration per skate motion. A skate motion has integrals of
acceleration and deceleration. This is the average of acceleration
integrals only.
The higher the value, the more powerful the skate motion.
Acceleration Symmetry (%)
The percentage indicating where acceleration on each side was
symmetrical.
Avg Decel per Motion (G)
Average deceleration per skate motion
Net Avg Acc per Motion (G)
The difference between average acceleration minus average deceleration
per skate motion. If this is a negative number, then likely the ski is
being glided on too long.
Min Avg Acc Per Motion (G)
Max Avg Acc Per Motion (G)
Min and Max average acceleration per skate motion
— Velocity —
Avg Forward Velocity (GPS) (m/s)
Based on the GPS measurement of forward distance traveled, this is the
velocity for the sample period.
Avg Angular Velocity (m/s)
This is the average velocity of the skate motions. It should be a
higher velocity than the average forward velocity, because more distance
is being traveled during the same time period.
Velocity Symmetry (%)
The percentage that velocity was equal on both sides.
